Features
What SmartCVI does today.
Every screenshot below is captured from a running instance loaded with synthetic demonstration data. No real patient data appears on this site.
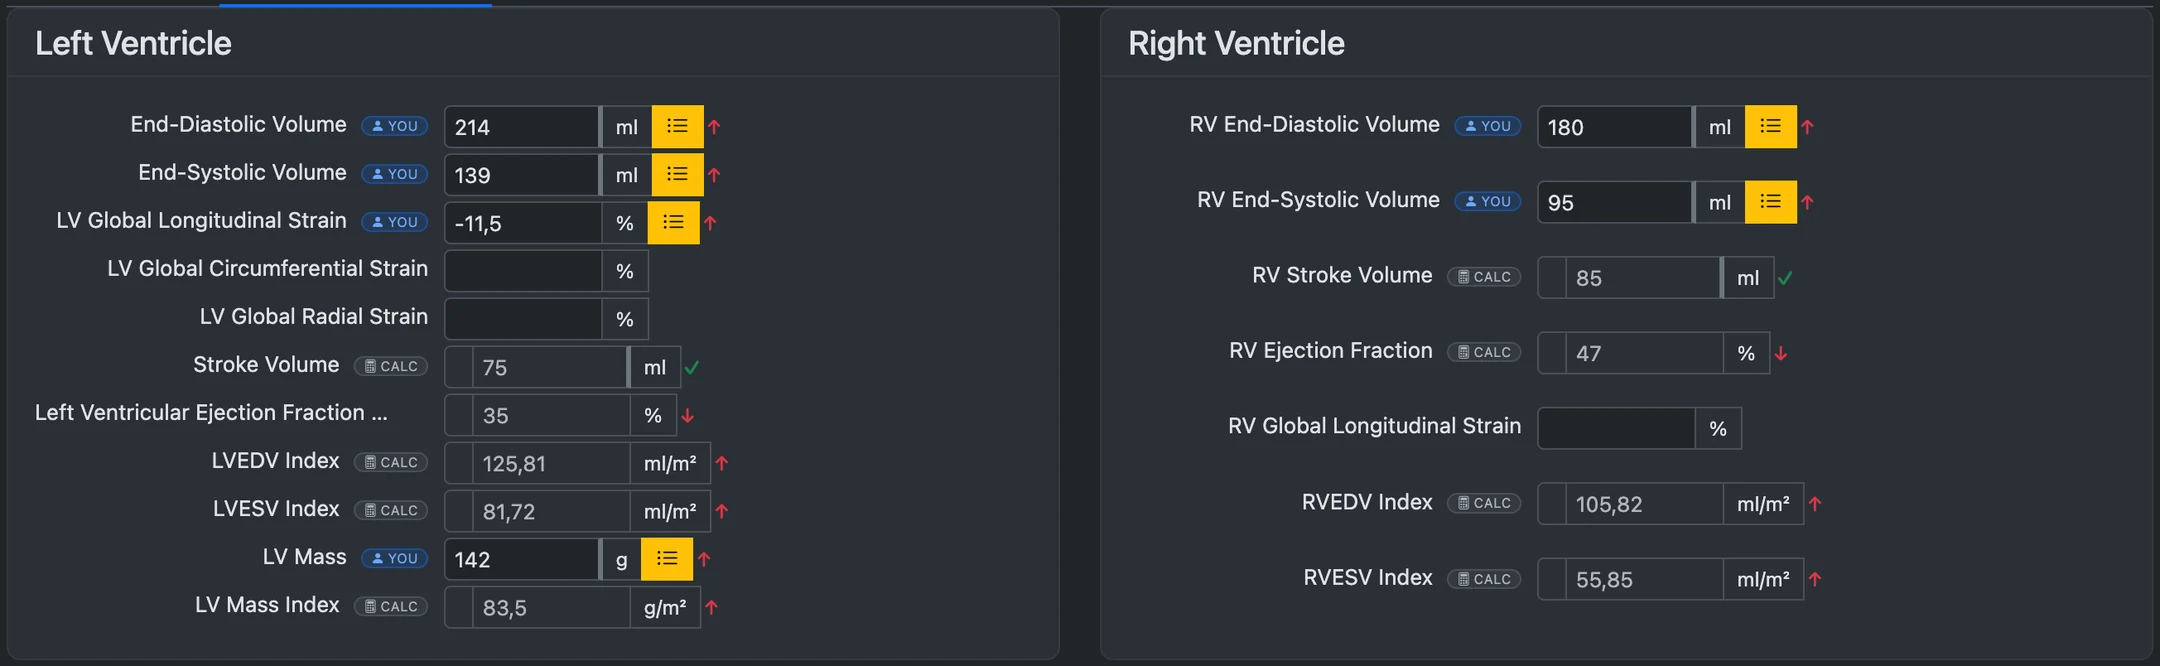
Machine values stay provisional until you accept them
DICOM Structured Reports and header tags are parsed the moment a study arrives and mapped onto form fields. Fields can be defined to calculate themselves from other values.
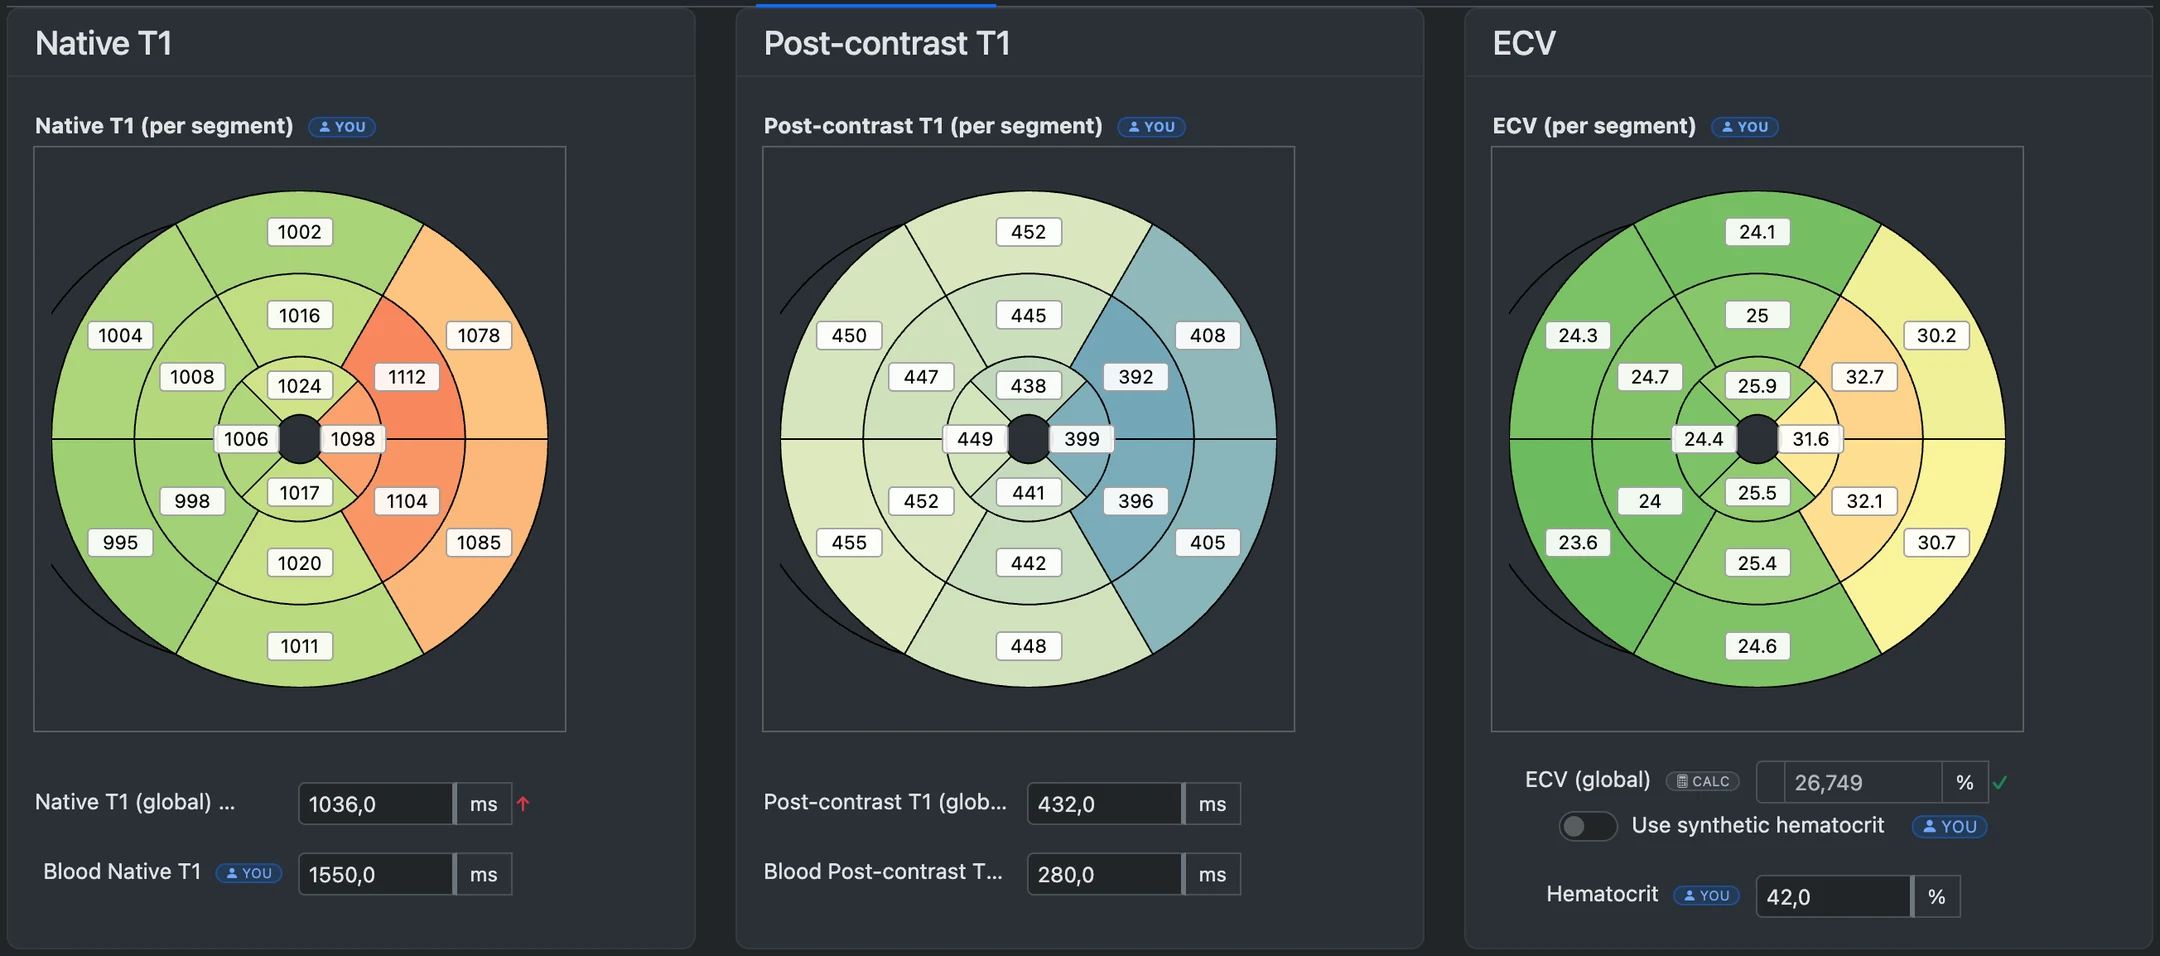
T1, T2 and ECV, segment by segment
Native and post-contrast T1 are entered per AHA segment, and ECV is derived for each of them from the two maps — or imported directly from the workstation where it is already available.
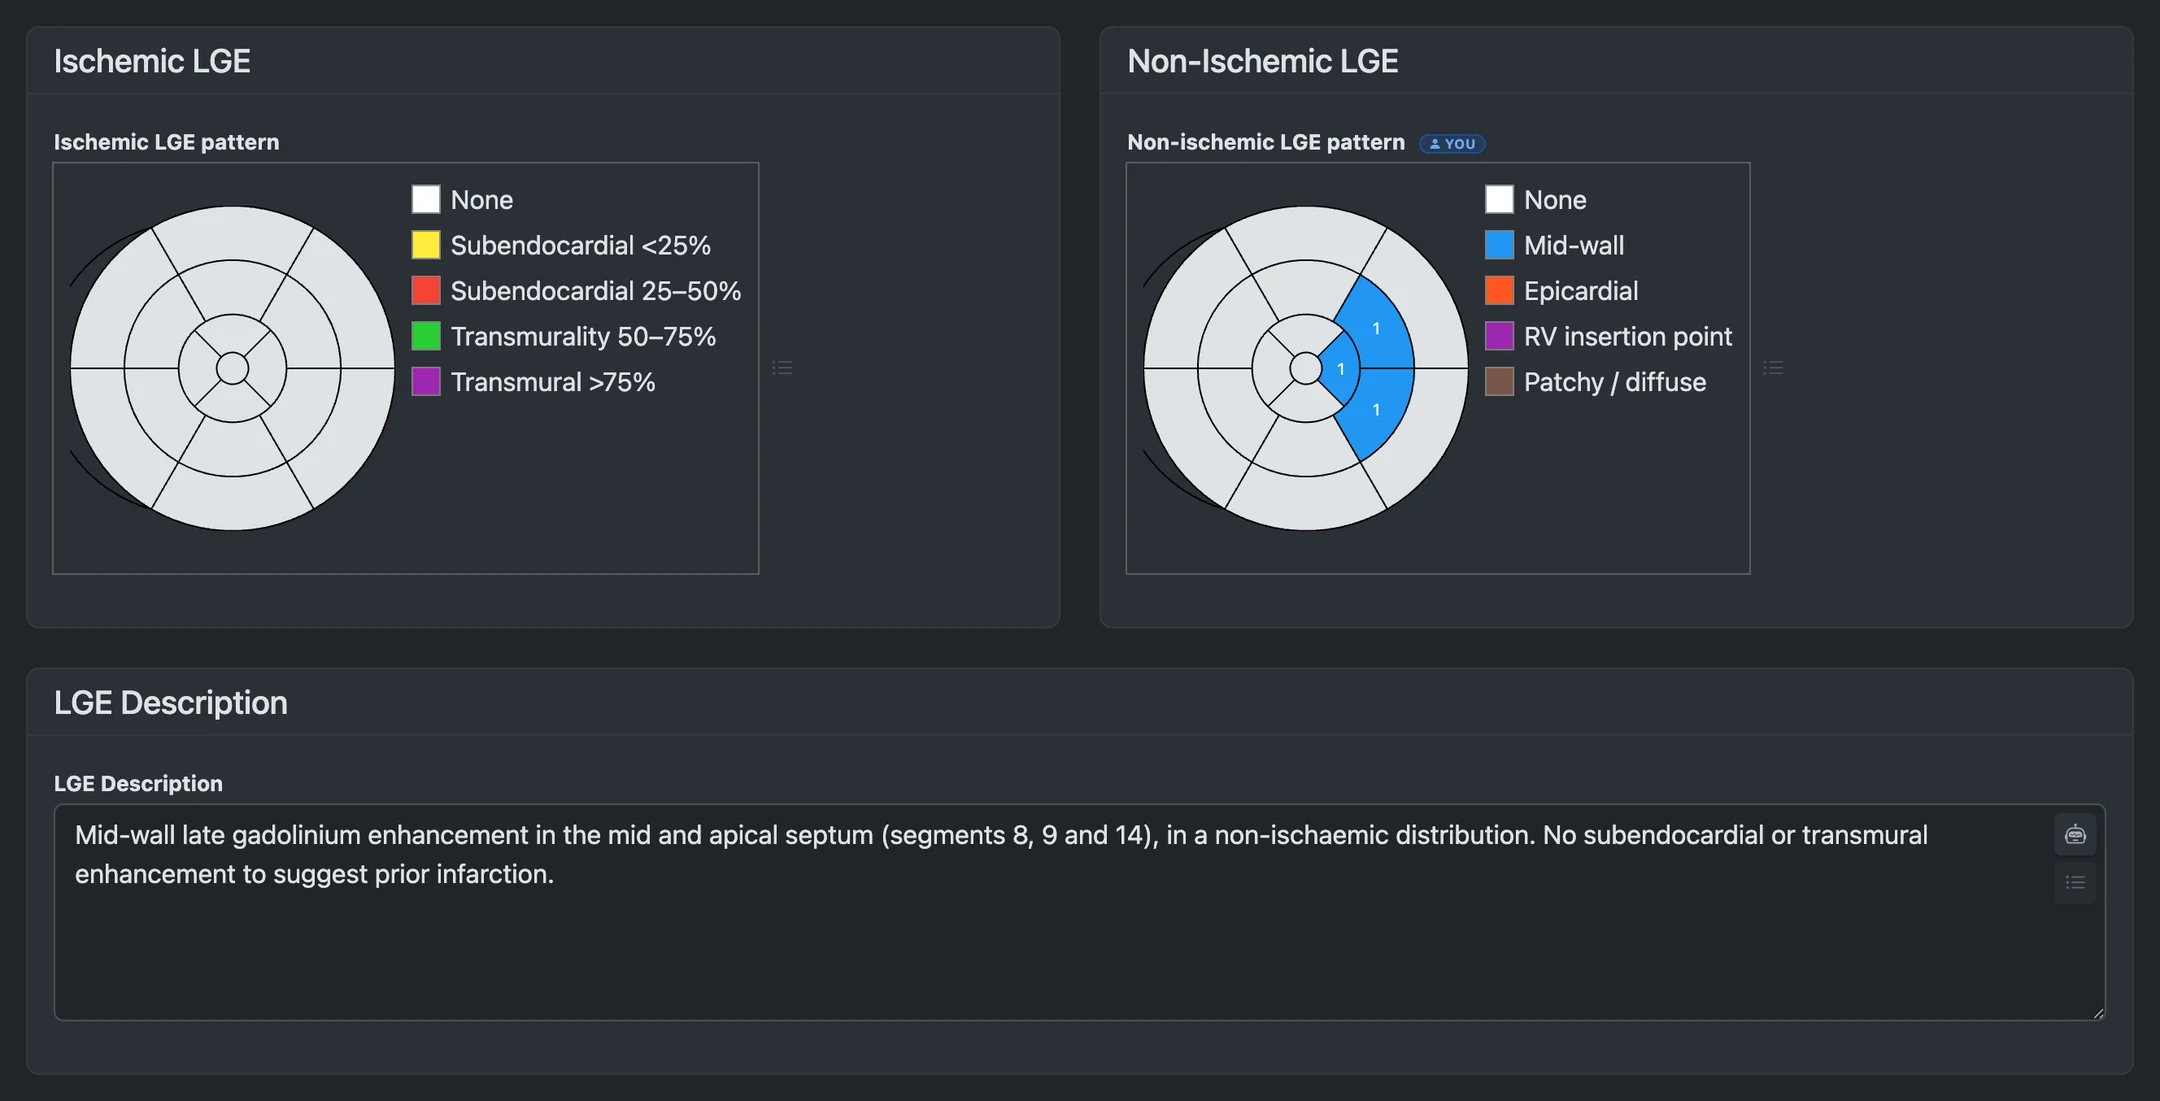
Bulls-eye plots that write their own paragraph
Wall-motion abnormalities, late gadolinium enhancement — you record your assessment quickly with intuitive bulls-eye widgets.
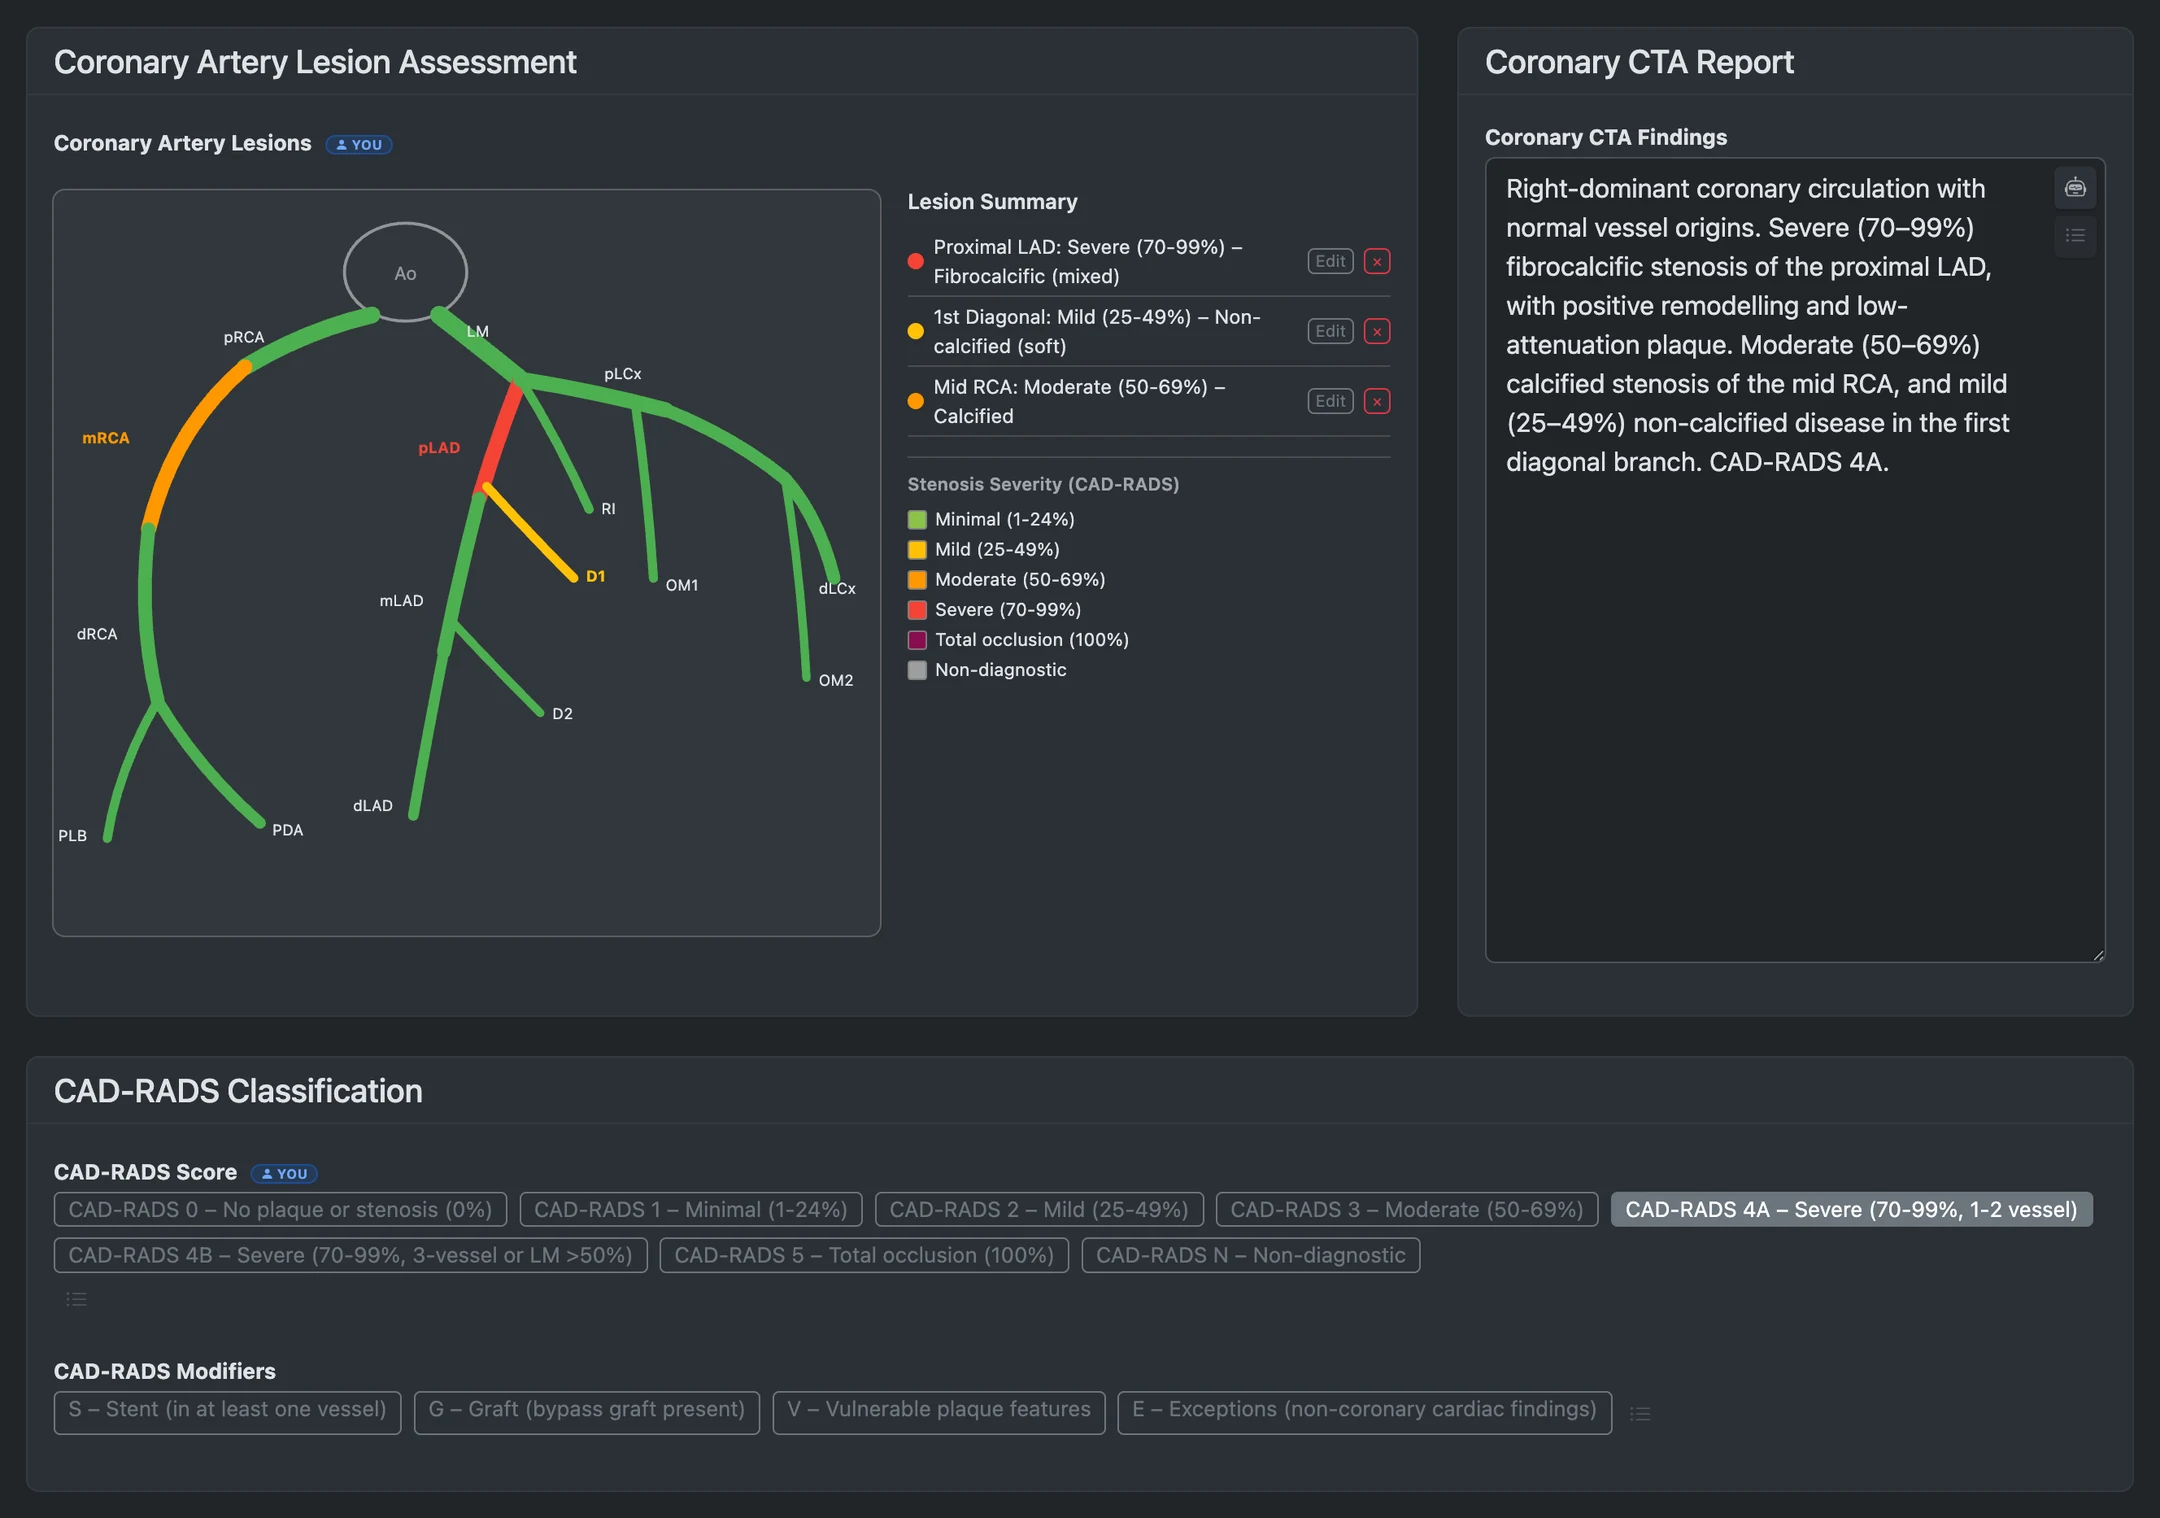
Segment-level coronary reporting
Record stenosis grade, plaque type and adverse features for every SCCT segment directly on the coronary tree.
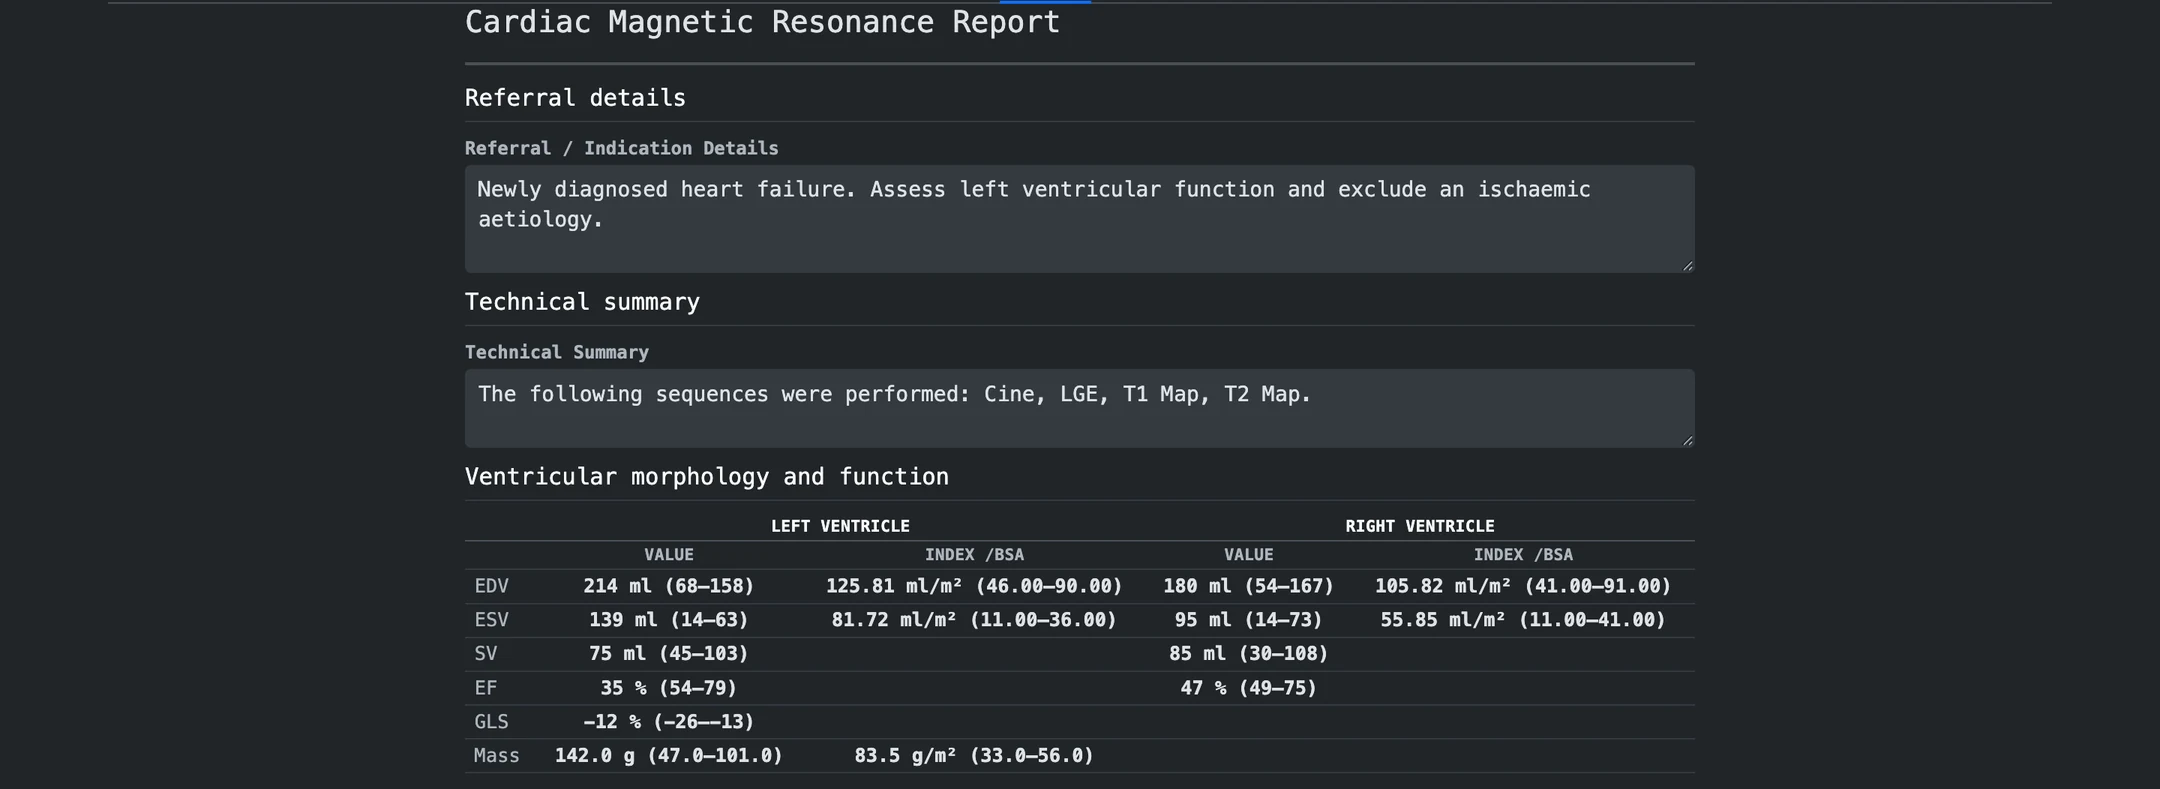
Assembled from the template, not from a clipboard
Headings, structured tables and reference-range hints come from the report template attached to that form version — one you define yourself.
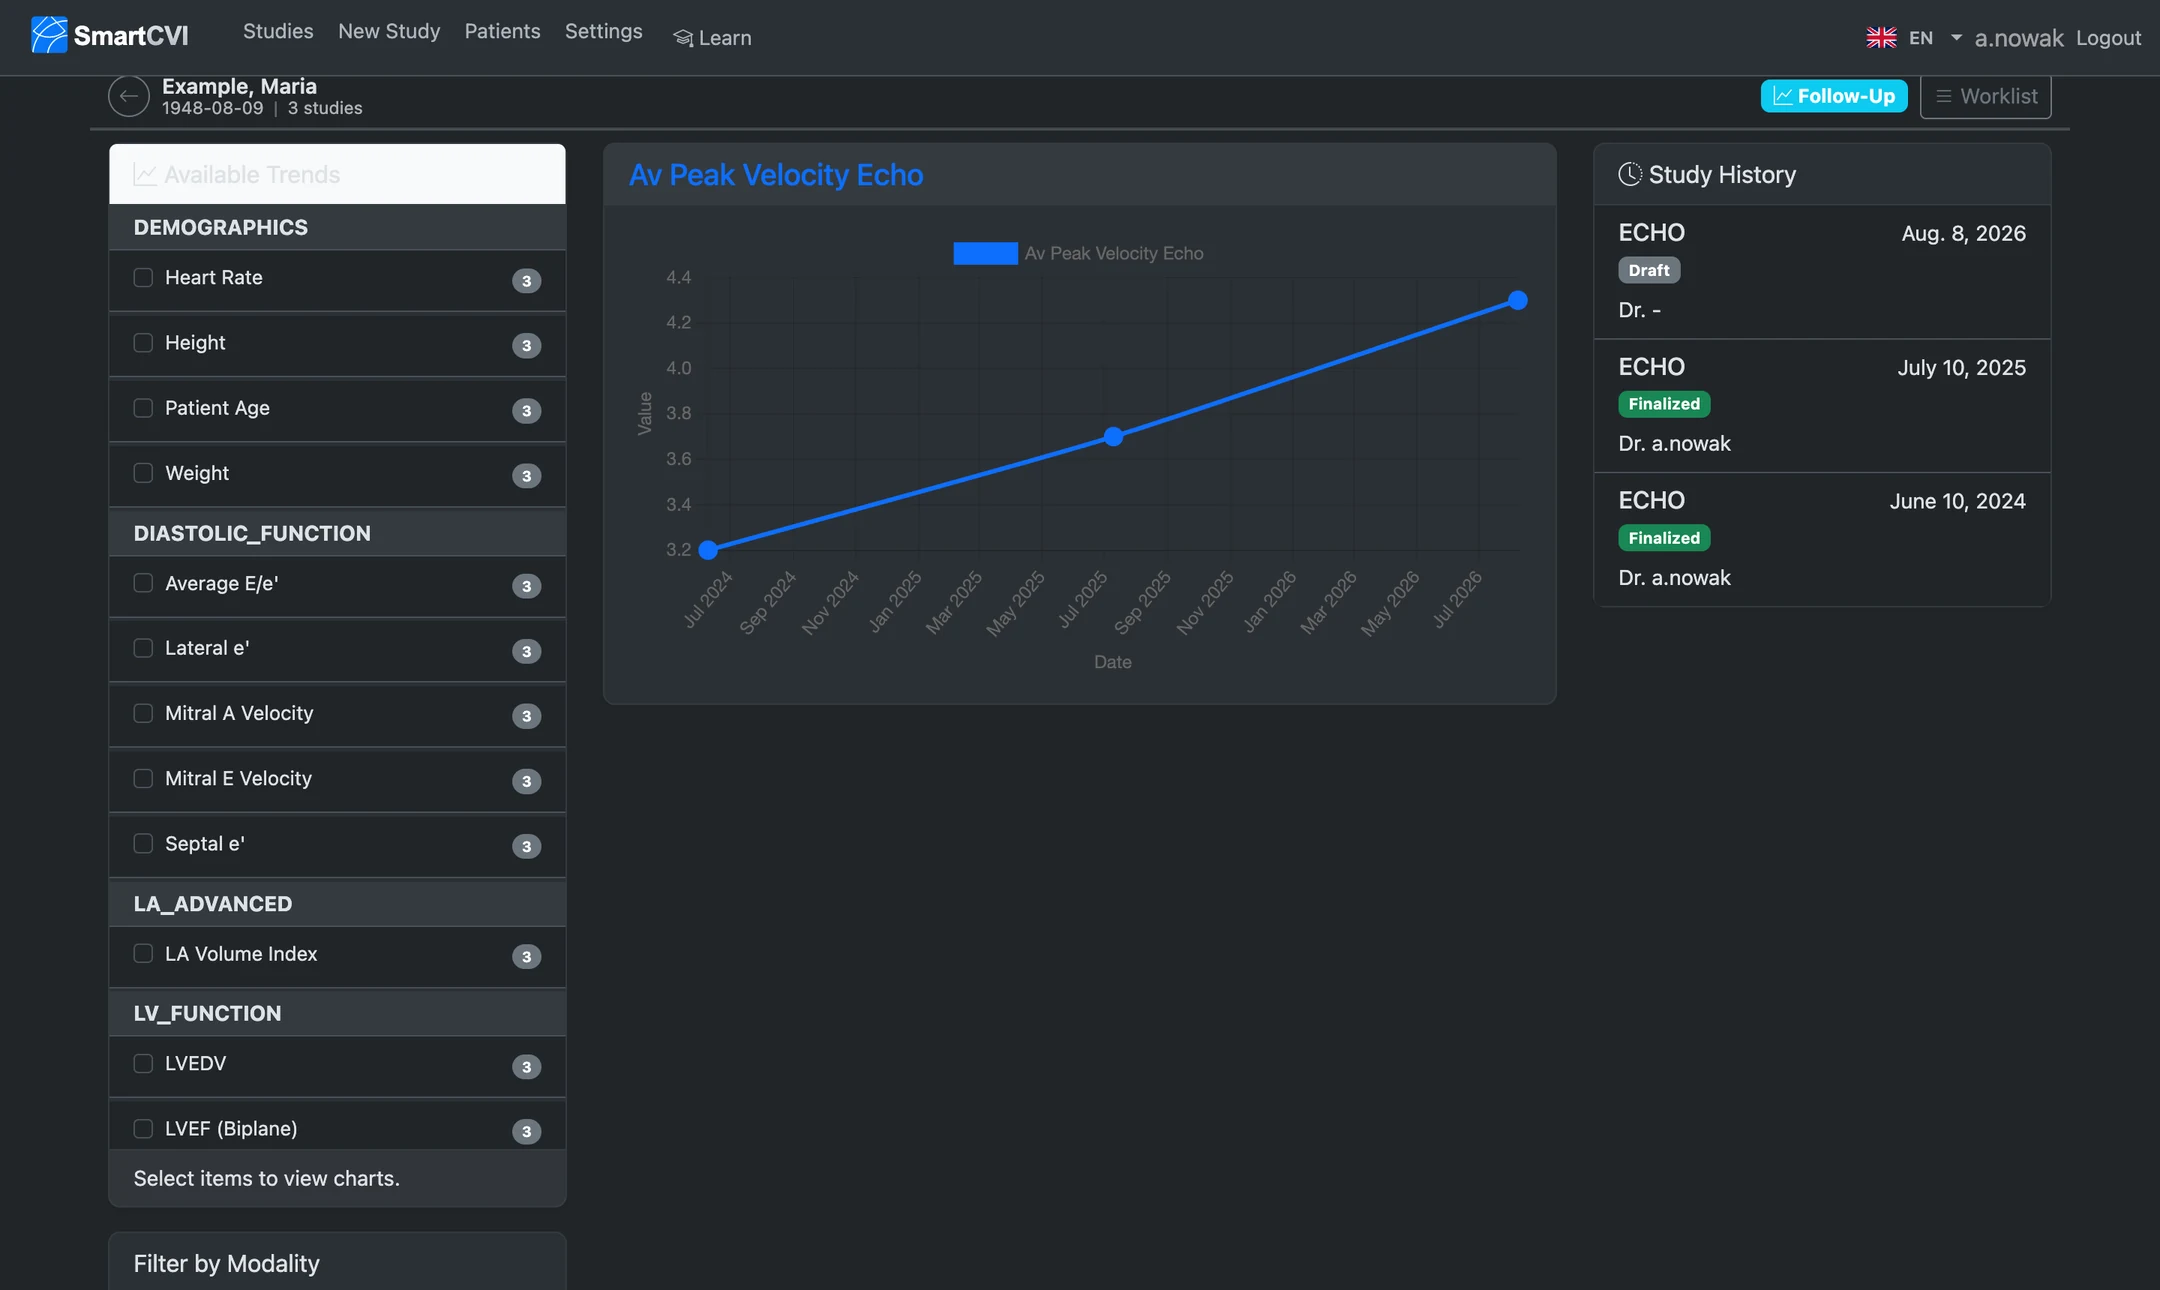
Prior studies are data, not just PDFs
Because every committed measurement is structured, any value can be compared directly and easily against the patient's previous studies.
And underneath
Catalogue-driven form engine
Report forms for echo, CMR, cardiac CT and stress protocols are defined through your own versioned configuration.
Traceability by design
Finalized studies are frozen as immutable snapshots with the exact form version, values and reference ranges used.
Optional AI assistance
An AI scribe (speech → structured findings) and text refinement run locally, on your own GPU server — never in the cloud.
Research and statistics export
A query and statistics engine assembles data across many studies quickly, alongside pseudonymized CSV export and DICOM export to folders or network shares — with anonymization built in.