Structured cardiac imaging reports, without the copy-paste.
SmartCVI turns echo, CMR, CCTA and stress studies into structured reports, so the data you already collect is used to its full potential. Measurements are imported straight from the ultrasound system or the reporting workstation — a few clicks and a high-quality report is ready.
- Measurements auto-imported from DICOM SR — reviewed and confirmed by you
- Derived metrics (BSA-indexed volumes, EF, ECV) calculated live
- Full auditability of everything done in the system
- Runs fully offline, on-premise, inside your hospital network
- Forms and variables live in the application's configuration — adapt them to your department yourself
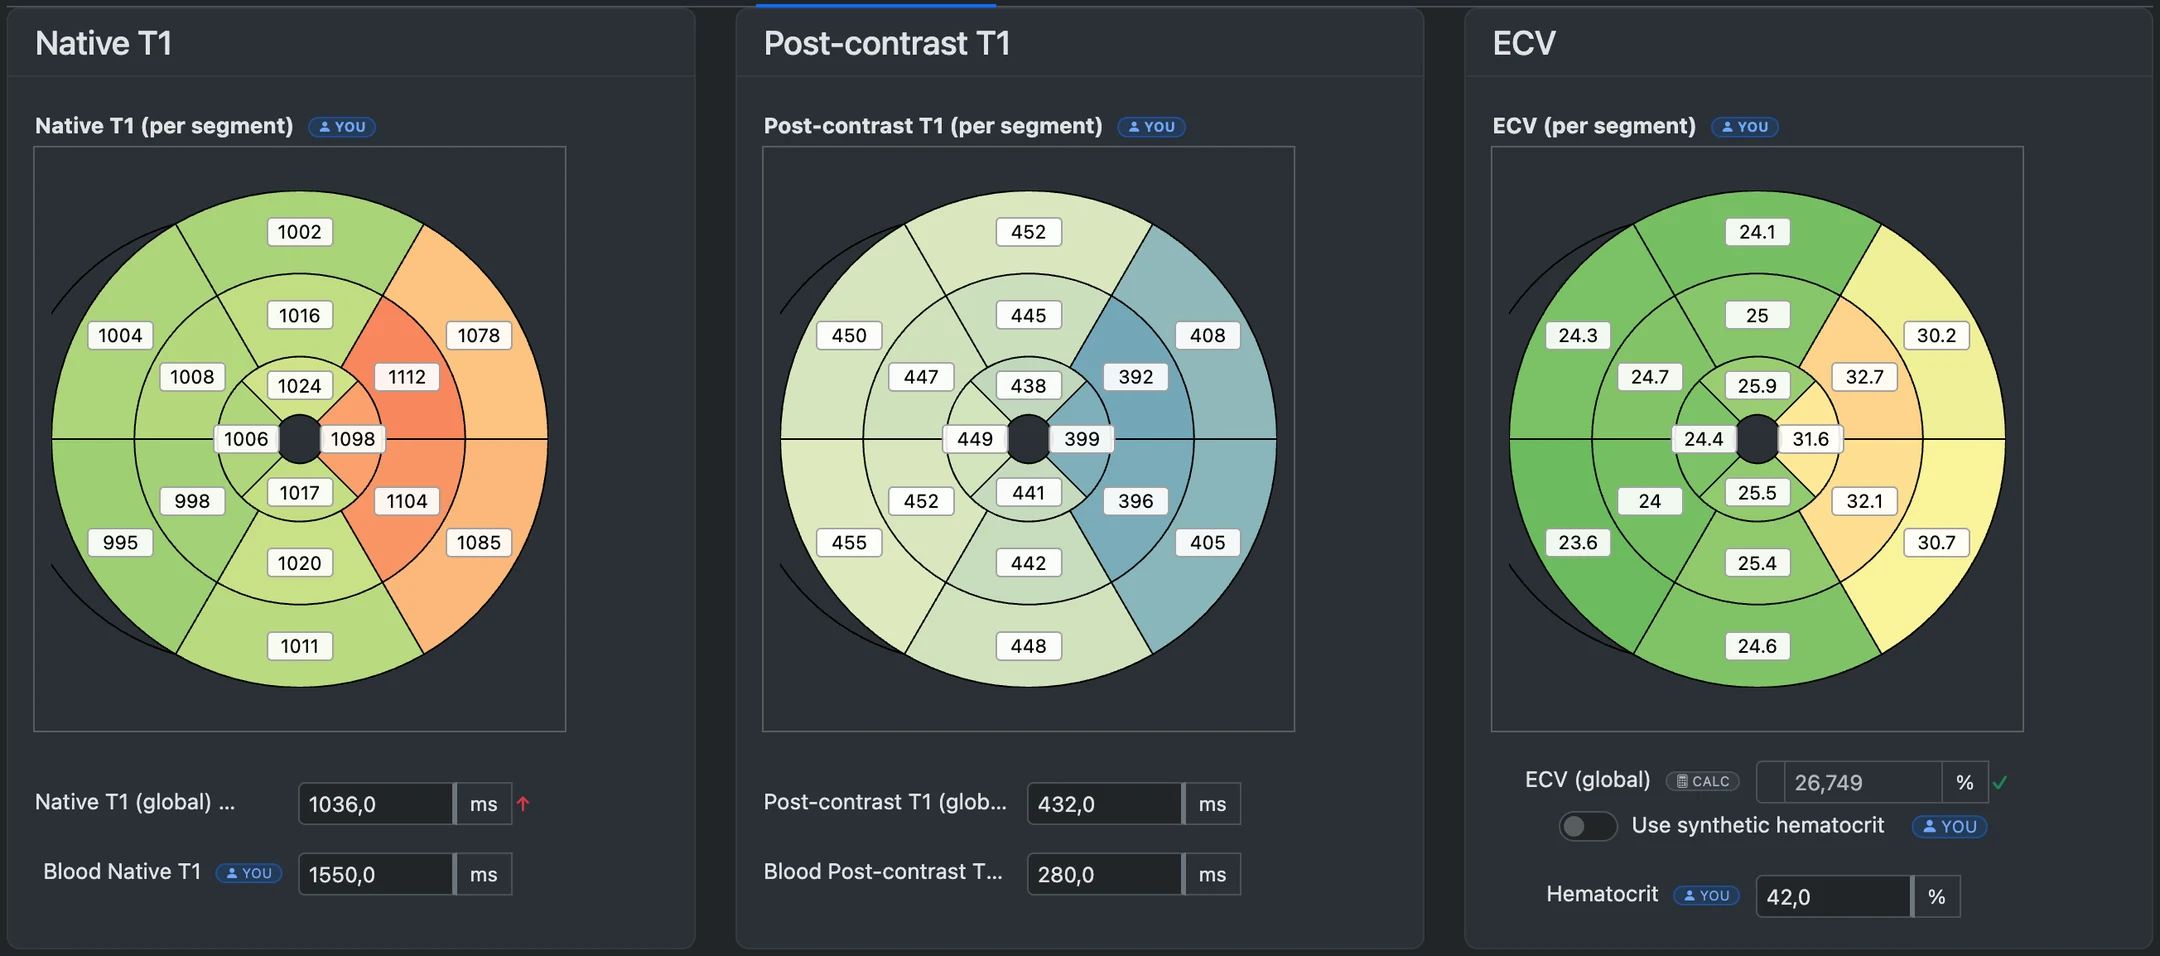
Parametric mapping: a value on every segment and ECV computed for each of them. Screenshots come from a running instance loaded with synthetic demonstration data — no real patients.
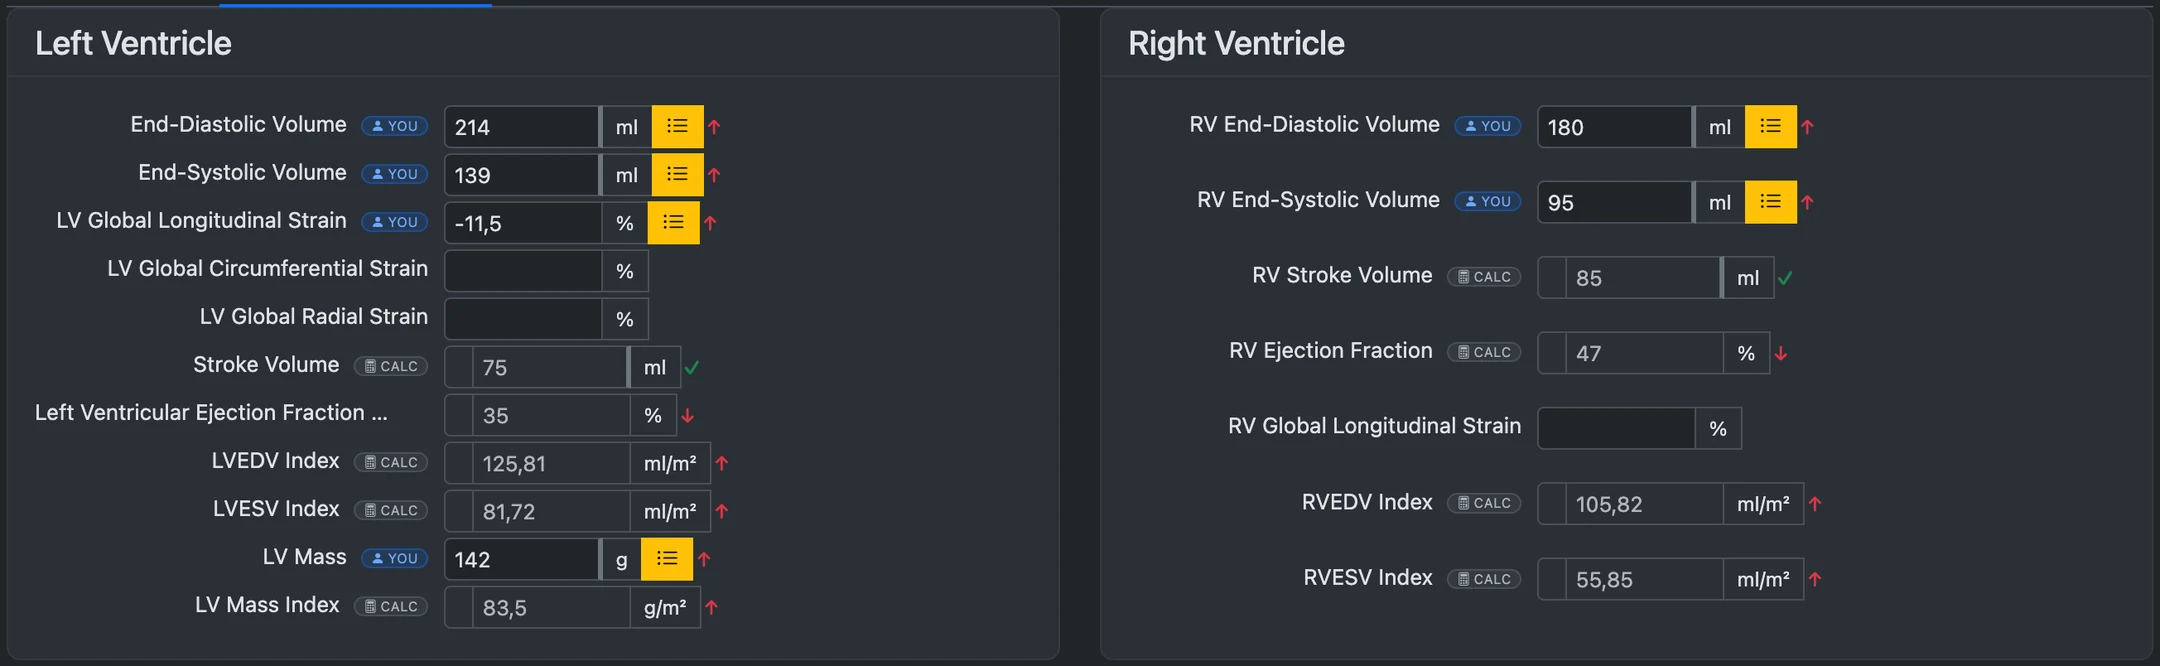
Measurements imported automatically
Values read from a DICOM Structured Report appear as provisional until you accept them. At that point user-defined calculations can run — stroke volume, ejection fraction, BSA-indexed volumes and mass, for example — and each field can be checked against the reference range for the patient's age and sex.
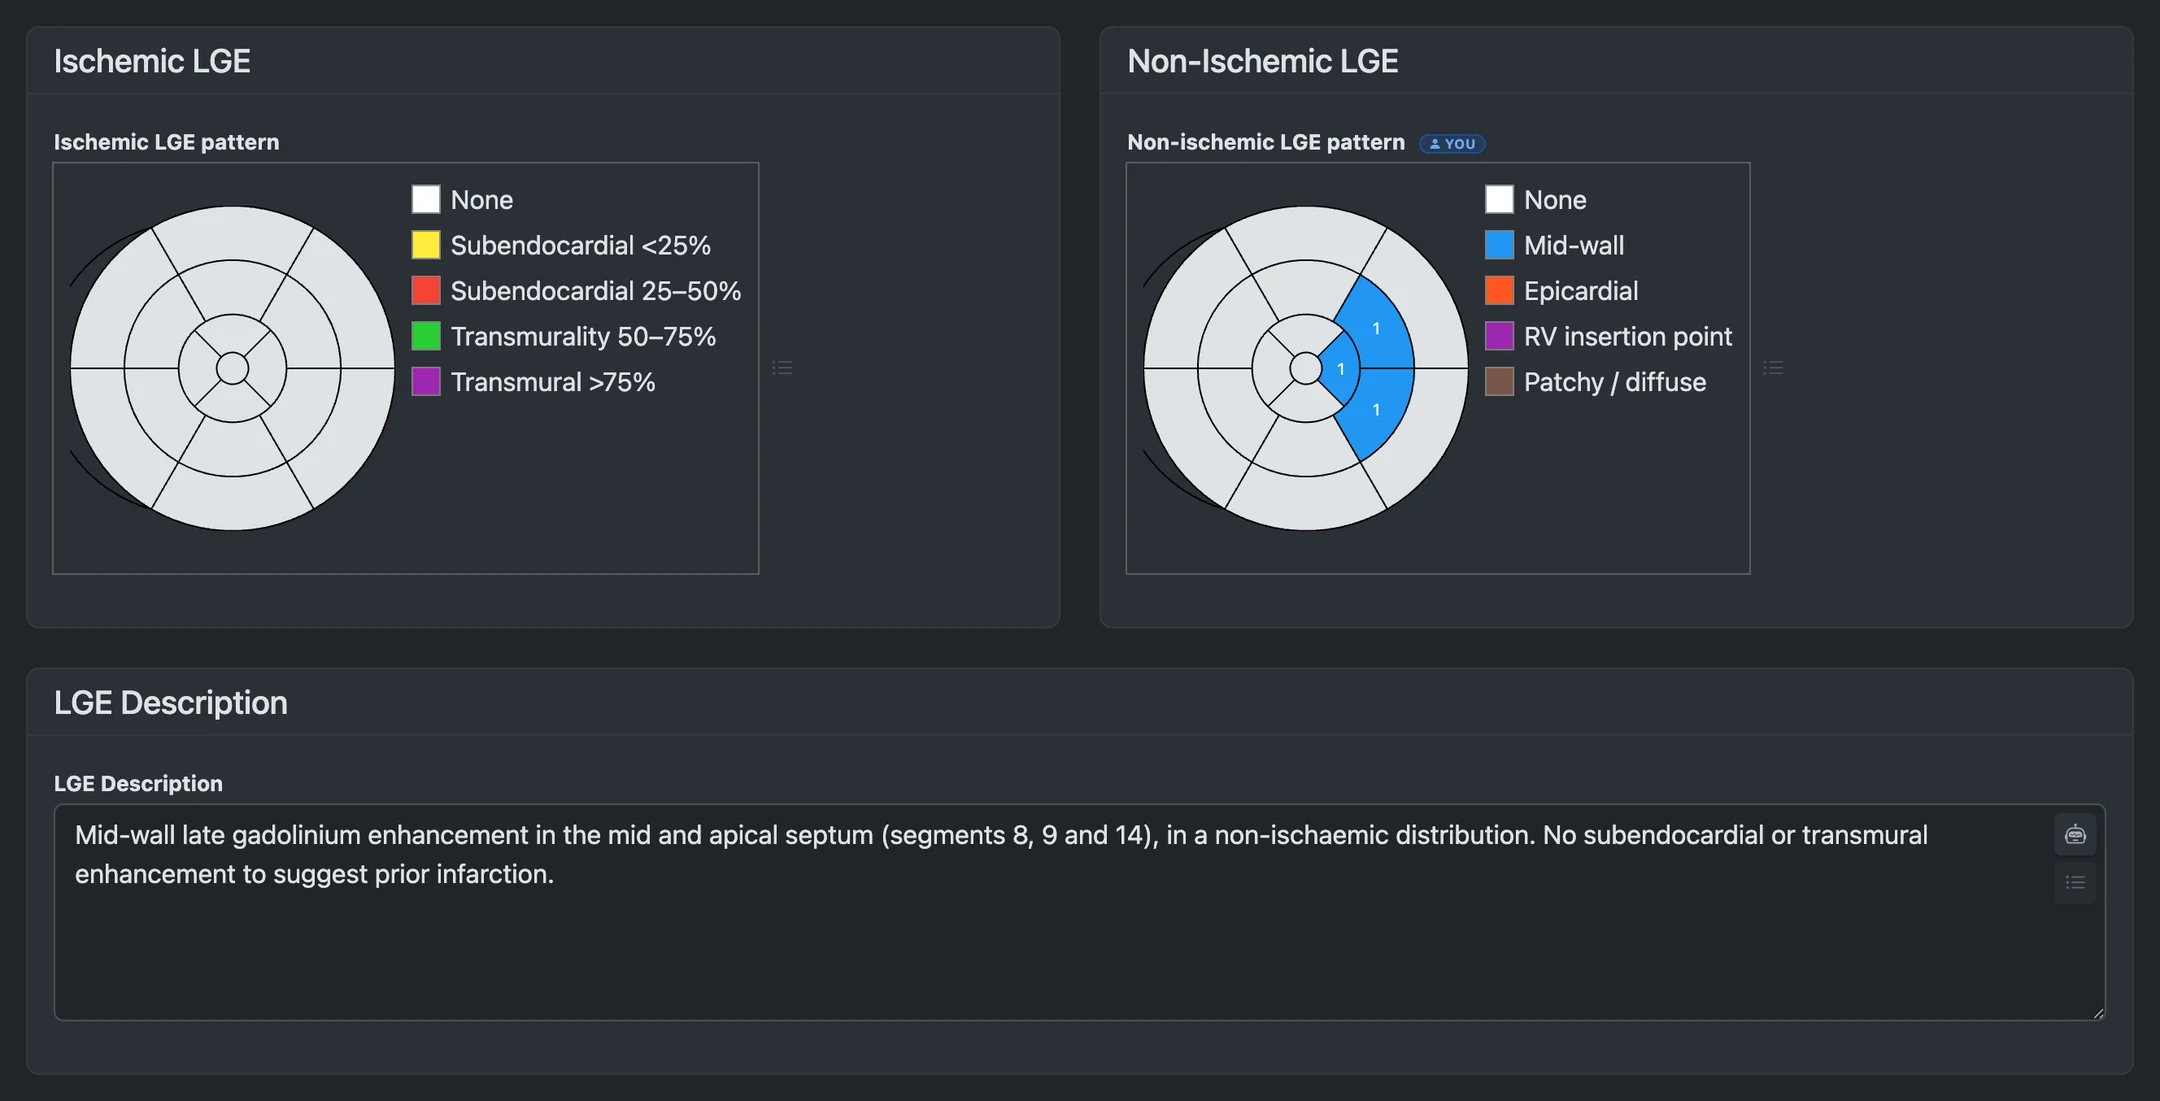
Intuitive, data-driven report wording
AHA 16/17-segment bulls-eye plots, the coronary tree and stress-stage matrices are ordinary form fields. Mark the segments and a first draft of that section's paragraph is generated for you.
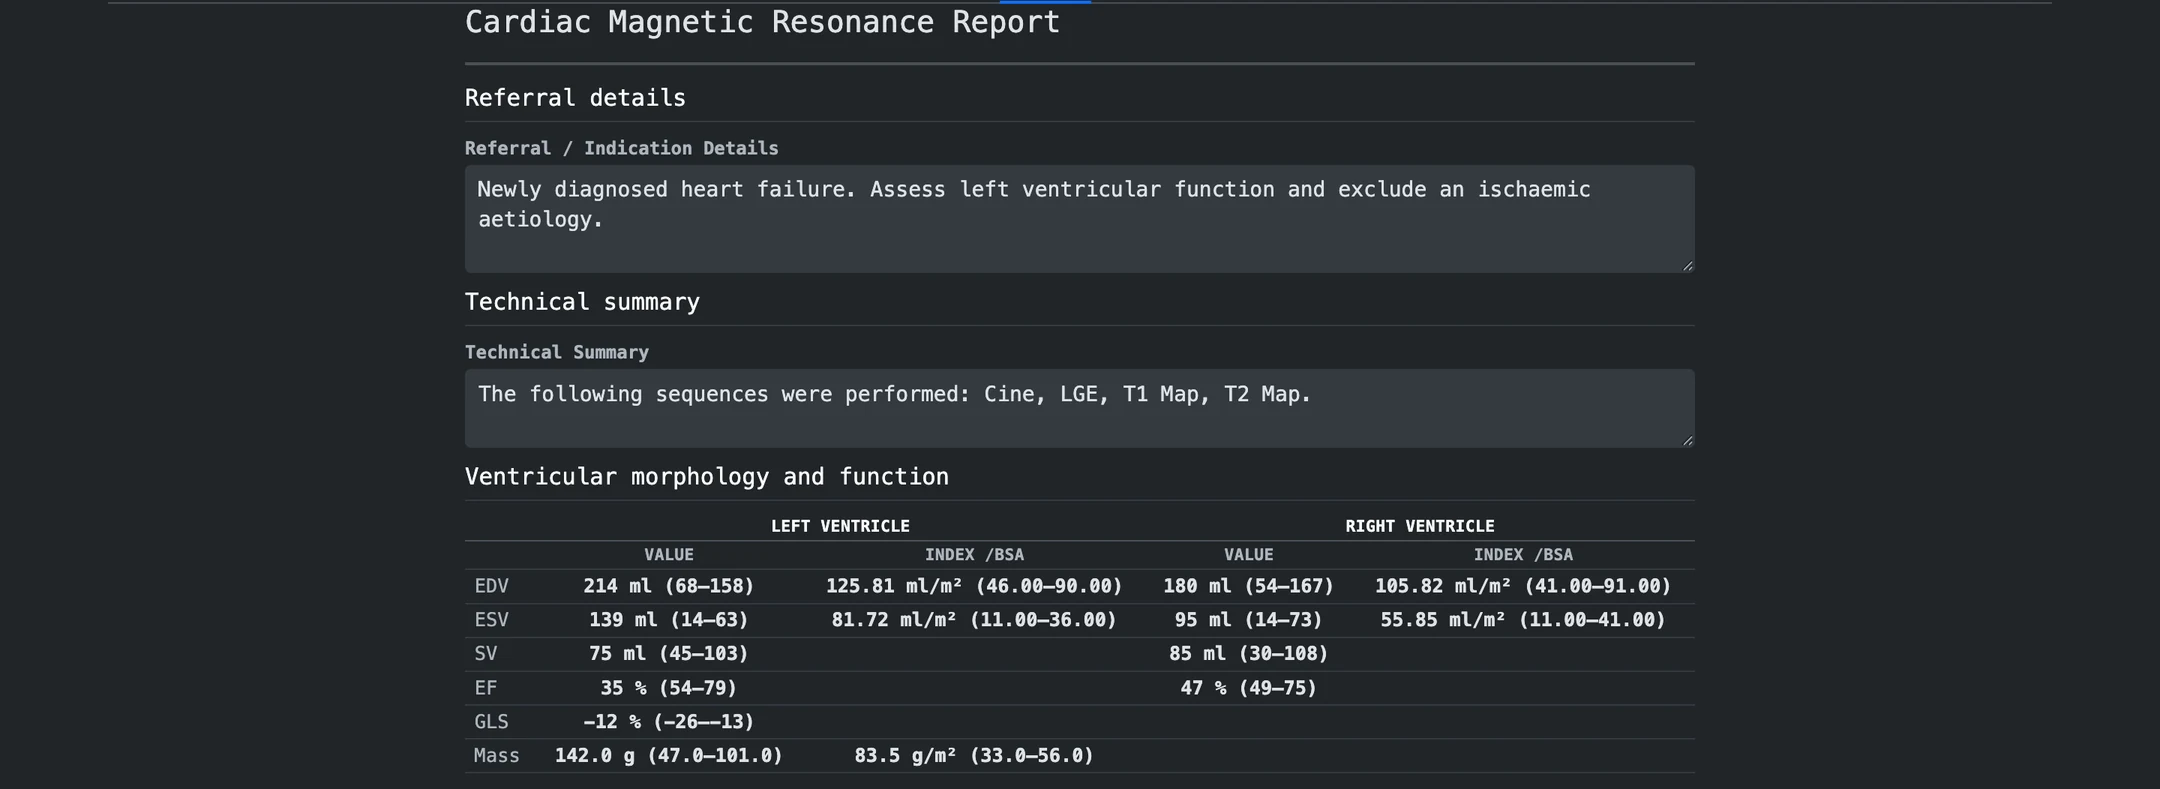
A report assembled from data
Instead of a traditional template, the draft report is built from sections generated automatically out of the structured data you entered, which you then edit into its final form.